Computing the Set
There is no formula to decide whether or not a complex number c = a + bi belongs to the Mandelbrot set (for any c). However, all c such that a2+b2 ≥ 4, do not belong to the set (exclusion condition), while all c for which there exists a zj = zk where j ≠ k do belong to the set (inclusion condition). For all other c, one can simply compute the defining sequence (as explained in Mandelbrot Set), until one, eventually, encounters a zn where a2+b2 ≥ 4 (and conclude that c does not belong to the set). However, for any c which actually is a member of the set, this will never happen, unless the inclusion condition is met.
In reality one simply sets a ceiling Max for n (which can be 256, 512, 100000 or any other number), and decide that cn belongs to the set whenever cn=a2+b2 < 4 for all n ≤ Max. This method can be supplemented by an approximation of the inclusion rule, such that membership is assumed if the absolute value of the difference between zn and zn-1 is less than a predefined constant zsmall. By remembering the entire sequence this method can be extended to looking at the difference between any two numbers in the sequence.
Drawing the Set
The following is looking at at some ways of drawing the set on a medium with a fixed number of points e.g. a computer screen. The medium then consists of x times y points where x is the medium's horizontal resolution while y is the medium's vertical resolution.
The first consideration is the mapping from complex plane coordinates to medium coordinates. Since any area of the complex plan has an infinite number of points, it is necessary to select a set of points which correspond to the medium's resolution, and then map each point to the medium's coordinates. An example will make this clearer:
A drawing medium consists of 2000 x 1000 points, and the part of the complex plan to be drawn is -1.0 to 0.5 along the horizontal axis and -0.25 to 0.5 along the vertical axis. Dividing 1.5 (that is 0.5-(-1.0)) by 2000, gives 0.00075, such that one will consider the points -0.5, -0.49925, -0.4985, ..., 1.0 along the horizontal axis, and similarly -0.25, -0.24925, -0.2485, ..., 0.5 along the vertical axis. These are the 2000000 points from the lower left (-1.0, -0,25) to the upper right (0.5, 0.5).
Additionally one has to decide the ceiling value Max as explained over, and a zsmall if the inclusion rule is to be used.
The simplest drawing strategy will then only consider if each point is member of the set or not. Member points are drawn with one particular color, while non-member points are drawn with another.
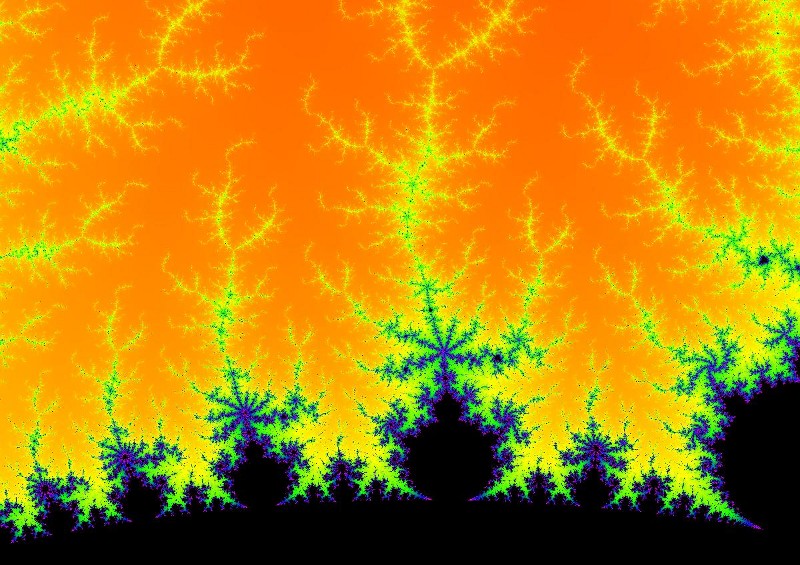
A more interesting method is to distinguish between how many iterations it takes to decide that a point is not a member of the set. This will be a number between 0 and Max as explained over. A color scale with Max values will then be used, such that each point is drawn with a color corresponding to the n where a2+b2 ≥ 4
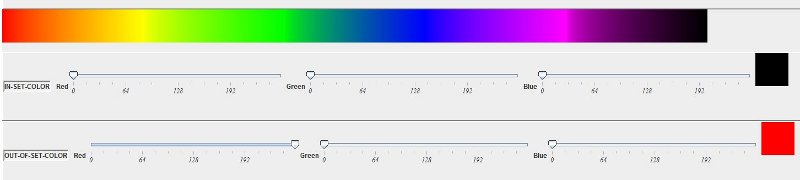
Rainbow-style color scale (Max=1280)
Mandelbrot set drawn with the scale over